Ganglinienfenster/en: Unterschied zwischen den Versionen
Ferrao (Diskussion | Beiträge) (Die Seite wurde neu angelegt: „#'''Independent creation of a hydrograph'' <br /> Double-click on the first line to edit the date and value. Double-click afterwards on the second line variabl…“) |
Ferrao (Diskussion | Beiträge) Keine Bearbeitungszusammenfassung |
||
| Zeile 23: | Zeile 23: | ||
Under '''Description''' the name of the chart is defined. There are now two possibilities to create a time series. | Under '''Description''' the name of the chart is defined. There are now two possibilities to create a time series. | ||
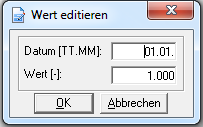
#'''Independent creation of a hydrograph'' <br /> Double-click on the first line to edit the date and value. Double-click afterwards on the second line variable times with appropriate values can be entered in the mode '''edit values'''. With '''OK''' both entries are taken over and jump directly to the next line. The time specification can be refined as desired. With '''Cancel''' all entries are stored and the editing mode ''edit values'' is terminated. <br /> [[Datei:Ganglinie006.png|Datei:Ganglinie006.png]] <br /> With '''Edit''' another line can be added and removed with '''Delete'''. The mean value is calculated automatically from the entered values. With interpolation activated, the values are interpolated between two dates. If the field interpolation is not active, the value for a date is assumed constant until the next date.<br /> Thus, the following annual cycle results:<br /> | #'''Independent creation of a hydrograph'' <br /> Double-click on the first line to edit the date and value. Double-click afterwards on the second line variable times with appropriate values can be entered in the mode '''edit values'''. With '''OK''' both entries are taken over and jump directly to the next line. The time specification can be refined as desired. With '''Cancel''' all entries are stored and the editing mode ''edit values'' is terminated. <br /> [[Datei:Ganglinie006.png|Datei:Ganglinie006.png]] <br /> With '''Edit''' another line can be added and removed with '''Delete'''. The mean value is calculated automatically from the entered values. With interpolation activated, the values are interpolated between two dates. If the field interpolation is not active, the value for a date is assumed constant until the next date.<br /> Thus, the following annual cycle results: <br /> | ||
Version vom 14. Januar 2021, 15:48 Uhr
The creation of a hydrograph takes place internally in a variant, whereby for each variant the hydrographs are created individually or taken over from another variant. Via the Menu bar -> System -> Yearly cycles / Weekly cycles / Daily cycles the hydrographs can be created and edited. The hydrographs are stored in the Territorial database.

With the menu item Display the charts are updated or sorted alphabetically. With the menu item Hydrographs new hydrographs are created, edited or deleted. This is also possible via the function bar File:Hydrograph003.png.

Create annual cycle
To create a new hydrograph, click on the icon ![]() . When creating annual hydrographs, a window with the question opens: Do you want to create an annual hydrograph with variable entries?
. When creating annual hydrographs, a window with the question opens: Do you want to create an annual hydrograph with variable entries?

If confirmed with yes:
- a variable period can be created for the hydrograph. The following window opens:

Under Description the name of the chart is defined. There are now two possibilities to create a time series.
- 'Independent creation of a hydrograph
Double-click on the first line to edit the date and value. Double-click afterwards on the second line variable times with appropriate values can be entered in the mode edit values. With OK both entries are taken over and jump directly to the next line. The time specification can be refined as desired. With Cancel all entries are stored and the editing mode edit values is terminated.
With Edit another line can be added and removed with Delete. The mean value is calculated automatically from the entered values. With interpolation activated, the values are interpolated between two dates. If the field interpolation is not active, the value for a date is assumed constant until the next date.
Thus, the following annual cycle results:

Wird mit nein bestätigt:
- wird eine konstante Ganglinie erstellt, bei der für jeden Monat ein Wert angegeben wird. Auch hier kann die Ganglinie selber erstellt oder aus einer anderen Variante übernommen werden. Ebenfalls haben Sie die Wahl zwischen interpolierten und nicht interpolierten Werten. Die Eingabe der Werte erfolgt durch Anklicken der entsprechenden Zeile.

Nachdem der variable oder konstante Jahresgang erstellt wurde, wird die Ganglinie mit Speichern gesichert. Mit Abbrechen findet keine Speicherung statt.
Wochengang erstellen
Bei der Erstellung von Wochengängen öffnet sich direkt ein Fenster mit konstanter Datumsangabe für jeden Tag. Auch hier kann die Ganglinie selber erstellt oder aus einer anderen Variante übernommen werden (siehe Jahresgang). Ebenfalls haben Sie die Wahl zwischen interpolierten und nicht interpolierten Werten. Die Eingabe der Werte erfolgt durch Anklicken der entsprechenden Zeile. Nachdem der Wochengang erstellt wurde, wird die Ganglinie mit Speichern gesichert. Mit Abbrechen findet keine Speicherung statt.

Tagesgang erstellen
Bei der Erstellung von Tagesgängen öffnet sich direkt ein Fenster mit der konstanten Datumsangabe für jede Stunde. Auch hier kann die Ganglinie selber erstellt oder aus einer anderen Variante übernommen werden (siehe Jahresgang). Ebenfalls haben Sie die Wahl zwischen interpolierten und nicht interpolierten Werten. Die Eingabe der Werte erfolgt durch Anklicken der entsprechenden Zeile. Nachdem der Tagesgang erstellt wurde, wird die Ganglinie mit Speichern gesichert. Mit Abbrechen findet keine Speicherung statt.
