Example of Use: Operating Plan Implementation
The example of the Wehebach-Dam is intended to illustrate the implementation of an operating plan in accordance with the laws described.
The Wehebach-Dam is a multi-purpose reservoir with the uses of water supply and flood protection. In addition, a regular discharge of 100 l/s into the lower reaches is to be maintained. The operator of the dam is the Water association Eifel-Rur, which is largely responsible for the drinking water supply of the greater Aachen area, the northern Eifel region and the provision of service water for several industrial companies. The catchment area of the dam is 43.61 km², the average annual inflow is 21 million m³, the storage capacity is 119.3%. The construction of the reservoir, built as a rockfill dam, was completed in 1983.
The following operating plan was drawn up for the Wehebach-Dam:
- Characteristics of the dam:
- max. content up to the top: 27.1 mio. m³
- capacity up to spillway: 25.06 mio.m³
- target water level (normal water level): see flood control reservoirs
- Levy amount for water supply:
The reservoir provides drinking water for two water supply companies. The requirements of the companies are available in daily demand values. For the provision of water, up to 11 million m³ must be provided annually for drinking water purposes, of which no more than 2.5 million m³ may be discharged each month.
- Regulatory outflow:
- The standard discharge is intended to provide a minimum flow below the dam and is set as follows depending on the inflow:
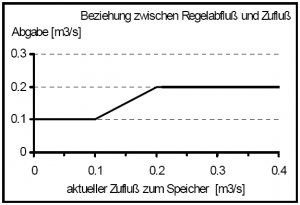
Inflow ≥ 200 l/s → Regulatory outflow = 200 l/s 100 l/s ≤ Inflow < 200 l/s → Regulatory outflow = Zufluss Inflow < 100 l/s → Regulatory outflow = 100 l/s
In each water management year, 4 m³/s must be released to the downstream watercourse as a flushing wave over a period of 6 hours at the latest by the end of March.
- Flood control areas:
- To ensure sufficient flood protection, a time-variable flood slope is designated. The lower limit of the shelters is defined as a damming target.
1.10. - 31.10. Flood shelter = 1.0 Mio. m³ Dam target = 24.06 Mio. m³ 1.11. - 30.11. Flood shelter = 2.75 Mio. m³ Dam target = 22.31 Mio. m³ 1.12. - 15.1. Flood shelter = 4.5 Mio. m³ Dam target = 20.56 Mio. m³ 16.1. - 31.3. Flood shelter = 2.5 Mio. m³ Dam target = 22.56 Mio. m³ 1.4. - 30.4. Flood shelter = 1.75 Mio. m³ Dam target = 23.31 Mio. m³ 1.5. - 30.9. Flood shelter = 1.0 Mio. m³ Dam target = 24.06 Mio. m³
- Clearance of flood control areas is done at the maximum allowable discharge.
- Maximum allowable flow:
- As long as the normal water level has not yet been reached, no more than 5 m³/s may be discharged to the downstream water.
If the normal height of the dam is exceeded and the inflow exceeds the maximum discharge of 5 m³/s, no more than 5 m³/s may be discharged from the bottom outlet. The remaining inflow is to be discharged via the spillway.
- Flood relief characteristic curve:
The characteristic curve is given in the form of an X-Y curve with interpolation points.
- Conversion of the operating plan to the terminology described above first requires identification of all requirements and uses for the dam and definition of the levy functions. The following information is provided only to illustrate the operating plan concept and does not purport to be complete or an accurate representation of actual conditions.
- Use: Water supply
temporal dependency: constant delivery function over the year, demand variable external dependencies: yes 1. current water demand [m³/s]: Factor1 (Calculation rule: Multiplication) 2. monthly balance of withdrawals: Factor2 (Calculation rule: Multiplication) 3. annual balance of withdrawals: Factor3 (Calculation rule: Multiplication) Delivery per time step: Calculation of the use 'water supply' by:
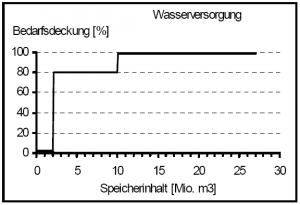
Abgabe = Factor1 × Factor2 × Factor3 × f(Storage content)
Conditions Discharge functions Covering demand [%]: Validity period: Jan. 1 - Dec. 31.
Explanation:
Reduction of demand coverage to 80% from a storage capacity < 10 million m³. If the storage content falls below 2 million m³, nothing more is withdrawn.
Conditions System state functions Actual water demand [m³/s]: (Factor 1)
Time reference: current value
Calculation rule: Multiplication
no function necessary Monthly balance of the withdrawals [-]: (Factor 2)
Time reference: Monthly balance sheet
Validity period: Jan. 1 - Dec. 31.
Limit value: 2.5 million m³
Calculation rule: Multiplication
Annual balance of withdrawals [-]: (Factor 3)
Time reference: Annual balance sheet
Validity period: Jan. 1 - Dec. 31.
Limit value: 11.0 million m³
Calculation rule: Multiplication
- Use: Flood protection
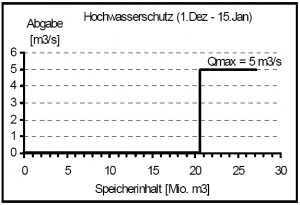
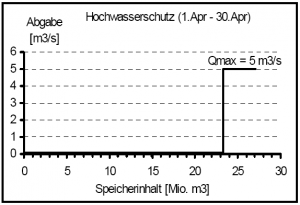
time dependency: yes external dependencies: no Levy per time step: The levy 'flood protection' is given directly as a function of the date
.Levy = f(memory content)
Conditions Discharge functions Validity period: Dec. 1 - Jan. 15. permissible maximum output: 5 m³/s
Reservoir target: 20.56 Mio m³
validity period: 16 Jan - 31 March permissible maximum output: 5 m³/s
Congestion target: 22.56 Mio. m³
Validity period: April 1 - April 30 permissible maximum output: 5 m³/s
Reservoir target: 23.31 million m³/s
For the remaining periods, the discharge functions are analogous.
- Use:' Control discharge
time dependency: ja external dependencies: ja 1. current inflow {m³/s]: Factor 1 (calculation rule: multiplication) Discharge per time step: BCalculation of the use 'control discharge' by:
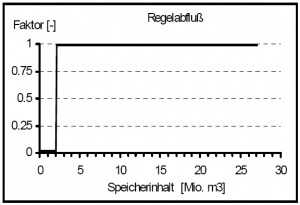
Discharge = Factor × f(memory contents)
Bedingungen Abgabenfunktionen Faktor Regelabfluss [-]: Gültigkeitsdauer: 1. Jan. – 31. Dez.
Erläuterung:
Fällt der Speicherinhalt unter 2 Mio. m³ wird kein Regelabfluss mehr aufrechterhalten.
Bedingungen Systemszustandsfunktionen Aktueller Zufluss [m³/s]: (Faktor 1)
Gültigkeitsdauer: 1. Jan. - 31. Dez.
zulässige Maximalabgabe: 5 m³/s
Erläuterung:
Übersteigt der Zufluss 0.2 m³/s wird weiterhin eine Abgabe von 0.2 m³/s gefahren.
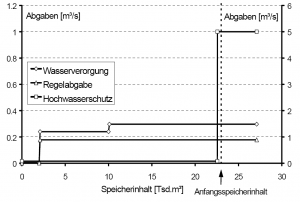
Für einen ausgewählten Zeitpunkt und einem angenommenen Anfangsspeicherinhalt von S0 = 23000 Tsd. m³ sind in Abbildung 26 alle Beziehungen aufgetragen. Zur Veranschaulichung wurde die Funktion für den Hochwasserschutz mit einem anderen y-Achsen Maßstab belegt.
| Parameter | Vorgaben | wirkt auf: |
|---|---|---|
| Zeitpunkt | 30. Januar | Hochwasserschutz, Wasservers. (Faktor1, Faktor2) |
| Anfangsspeicherinhalt | 23.000 Mio. m³ | alle Abgabenfunktionen |
| mittlerer Tageszufluss | 0.180 m³/s | Regelabgabe |
| mittlerer Wasserbedarf | 0.300 m³/s | Entnahme Wasserversorgung |
| Entnahme Wasservers. seit 1.Jan. | 0.750 Mio. m³ | Entnahme Wasserversorgung |
