Translations:Betriebsregeltypen/26/en: Unterschied zwischen den Versionen

Aus TALSIM Docs
Keine Bearbeitungszusammenfassung
 
Zeile 1: Zeile 1:
:[[Datei:Theorie_Abb7.png|thumb|Figure 7: Pool-based operating plan with linear interpolation between successive time reference points]]Such a view is practical but not yet complete, as can be shown below. A three-dimensional representation of a simple pool-based operating plan makes this clear. On the X-axis is the time, on the Y-axis the storage capacity is plotted, while the Z-axis shows the output directed upwards.
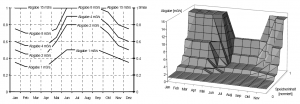
:[[Datei:Theorie_Abb7.png|thumb|Figure 7: Pool-based operating plan with linear interpolation between successive time reference points]]This view is practical but not yet complete: A three-dimensional representation of a simple pool-based operating plan makes this clear. On the X-axis is the time, on the Y-axis the storage capacity is plotted, while the Z-axis shows the output directed upwards.

Aktuelle Version vom 24. März 2021, 16:15 Uhr

Information zur Nachricht (bearbeiten)
Zu dieser Nachricht ist keine Dokumentation vorhanden. Sofern du weißt, wo und in welchem Zusammenhang sie genutzt wird, kannst du anderen Übersetzern bei ihrer Arbeit helfen, indem du eine Dokumentation hinzufügst.
Nachricht im Original (Betriebsregeltypen)
:[[Datei:Theorie_Abb7.png|thumb|Abbildung 7: Lamellenplan mit linearer Interpolation zwischen aufeinander folgenden Zeitbezugspunkten]]Eine solche Ansicht ist zwar praktisch aber noch nicht vollständig, wie sich nachfolgend zeigen lässt. Durch eine dreidimensionale Darstellung eines einfachen Lamellenplans wird dies deutlich. Auf der X- Achse ist die Zeit, auf der Y-Achse der Speicherinhalt aufgetragen, während die Z-Achse die Abgabe nach oben gerichtet anzeigt.
Figure 7: Pool-based operating plan with linear interpolation between successive time reference points
This view is practical but not yet complete: A three-dimensional representation of a simple pool-based operating plan makes this clear. On the X-axis is the time, on the Y-axis the storage capacity is plotted, while the Z-axis shows the output directed upwards.