Translations:Ganglinienfenster/10/en
Version vom 16. Februar 2021, 14:35 Uhr von T.Schnellbach (Diskussion | Beiträge)
- Individual Creation of a Hydrograph
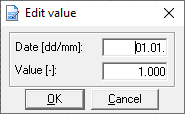
Double-click the first line to edit the displayed date and value. Afterward, double-clicking the second line selects it for edits. Clicking the Edit button allows entering flexible times with their corresponding values. Confirming the values with OK inserts the values in the chart and the next line is automatically selected for editing. Times can be particularized in the desired resolution. Clicking the Cancel button all previously edited entries are stored and the editing mode is terminated.
With Edit another line can be added and removed with Delete. The mean value is calculated automatically from the entered values. With interpolation activated, the values are interpolated between two dates. If the field interpolation is not active, the value for a date is assumed constant until the next date.
Thus, the following annual cycle results: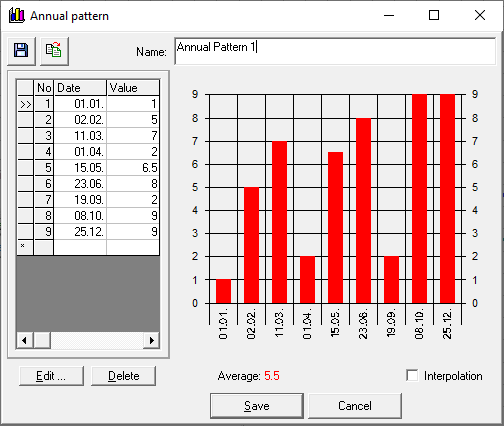
- Take over of an already existing hydrograph
If yearly, weekly, daily hydrographs already exist in other variants, which can be taken over, click on the symbol . An overview with all projects and variants opens. Now click on the corresponding variant and select the hydrograph you are looking for. With Apply the data are transferred into their new time series.


