Fenster Kurzfristprognose/en: Unterschied zwischen den Versionen
Ferrao (Diskussion | Beiträge) (Die Seite wurde neu angelegt: „==Range Load Definition==“) |
Ferrao (Diskussion | Beiträge) (Die Seite wurde neu angelegt: „The load definition of a short-term forecast can be entered as inflow or precipitation, depending on the system element, in the tabs of the same name. For sing…“) |
||
| Zeile 87: | Zeile 87: | ||
==Range Load Definition== | ==Range Load Definition== | ||
The load definition of a short-term forecast can be entered as inflow or precipitation, depending on the system element, in the tabs of the same name. For single dischargers the load is defined as inflow, i.e. flood wave, for catchment areas as precipitation, i.e. model rain. | |||
Version vom 26. November 2020, 18:42 Uhr
The Short Term Forecast window is opened by clicking the icon ![]() in the function bar of the Talsim-NG main window. Alternatively the window can be opened in the system administration via the context menu, which opens with a right-click on the variant (menu item: Short term forecast (model rain)).
in the function bar of the Talsim-NG main window. Alternatively the window can be opened in the system administration via the context menu, which opens with a right-click on the variant (menu item: Short term forecast (model rain)).
The short-term forecasts are created and managed in this window.
The simulation run for the created short-term forecast is then started in the system administration via the context menu of the simulation (Simulation -> Start simulation).

The window consists of:
- a menu bar (at the top)
- a selection menu with already created short-term forecasts (under menu bar)
- Display area (top left)
- Simulation area (middle left)
- Area with the load definitions (right) separated into the tabs
- Inflow
Precipitation
Forecast Menu

Create new forecast
By selecting the menu item Create new forecast a dialog window opens in which the name or a short description for the new short-term forecast is entered.

Prognose kopieren
When the menu item Copy forecast is selected, the dialog window opens again in which the name of the new short-term forecast is entered. When confirming with OK the forecast selected in selection menu of short-term forecasts is copied.
Save forecast
By selecting the menu item save the short-term forecast is saved with the current settings. Alternatively, it can also be saved using the save button at the bottom left of the window.
Confirm forecast
'Attention! Is no longer supported! Leads to program crash!
Delete forecast
Deletes the forecast selected in the selection menu.
Set precipitation factors
Imports the scaling factors for the model rainfall of each catchment area from a file. The file must have the name N_Factor.txt and be located in the same directory as the connected databases (dataBase, see also Directory Structure). The file contains all indentations
pretty close up

The selection menu is used to select the one to be processed from the short-term forecast that has been created. On the right side is the Name button, which can be used to change the name of the selected short-term forecast.
Range Display
In the area Display there is a button Diagram, with which the flood waves or the model rule can be displayed graphically. If the tab Precipitation is opened, the globally set model rain is displayed when pressing the button (i.e. before scaling with factors for the individual catchment areas). If the Inflow tab is open, the single feeder must first be selected in the Single Feeder area. Then the flood wave assigned to the single discharger in the Attributes of the HW wave area is displayed (including the adjustment by the attributes set for the catchment area).
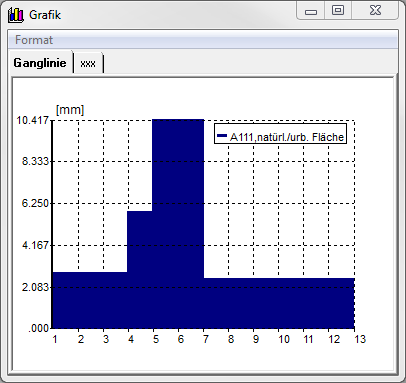
Grafikfenster Modellregen
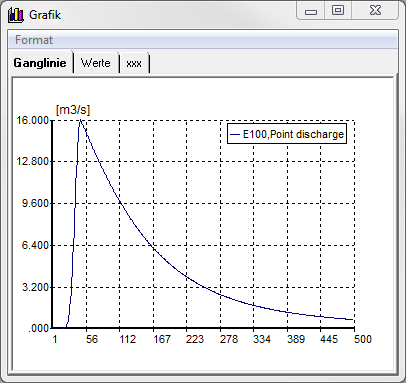
Grafikfenster Hochwasserwelle


The window has the tabs chart and xxx. The tab Hydrograph shows the graphic, in xxx the values for the grid points given in the simulation area are listed in a table.
Via the menu format it is possible to format the graphic (settings for grid, axes and labels).
Simulation area
The general simulation settings such as start of simulation (format: DD.MM.YYYY hh:mm), time step [min], time steps to be simulated [-] are entered in the Simulation section.
Range Load Definition
The load definition of a short-term forecast can be entered as inflow or precipitation, depending on the system element, in the tabs of the same name. For single dischargers the load is defined as inflow, i.e. flood wave, for catchment areas as precipitation, i.e. model rain.
Zufluss
Der Reiter Zufluss gliedert sich in die beiden Bereiche Einstellung (global) und Einzeleinleiter.

Im Bereich Einstellungen werden die globalen Einstellungen wird das Hochwasserereignis gesetzt. Aus dem Auswahlmenü wird das Hochwasserereignis ausgewählt. Dieses muss zuvor angelegt werden. Hier können auch die Anlaufzeit und der Scheitelwert global für alle Zuläufe skaliert werden.
Im Bereich Einzeleinleiter erfolgen die Einstellungen für die einzelnen Einzeleinleiter. Dazu wird der Einzeleinleiter in der Liste markiert. Danach wird die jeweilige Hochwasserwelle für den Einzeleinleiter aus dem Auswahlmenü gewählt. Im unteren Bereich können außerdem noch einzelne Attribute der Hochwasserwelle für den ausgewählten Einzeleinleiter verändert werden.
Niederschlag
